Compare Your Performance Metrics
Expert benchmarking insights.
Every day, over 8 billion searches are made on Google, each representing a unique opportunity for nonprofits to connect with potential supporters. If you’re wondering whether your Google Ad Grants campaigns are truly maximizing these opportunities, you’re not alone. When managed effectively, Ad Grants can be a mighty tool. But how can you ensure they’re reaching their full potential?
That’s where benchmarking comes in. By comparing your performance metrics to those of others in your industry, you can uncover great room for growth. While many nonprofits keep their data close to the chest, we believe in transparency and the power of shared knowledge. In this article, we’re pulling back the curtain and revealing our Ad Grants benchmarks, categorized by the various industries in which our client organizations operate.
Key Performance Indicators
Before we go ahead and dive into the benchmarks let’s have a look at the KPI (Key Performance Indicators) which will play an essential role during the benchmarking process:
- CTR (Click-Through-Rate) – measures the percentage of users who click through to your website. This metric is vital because it not only shows how effectively your ad copy engages viewers but it is also critical for maintaining compliance with Google Ad Grant policies. To avoid your Google Ad Grant account suspension, you must maintain a minimum CTR of 5% each month.
- CPC (Cost-Per-Click) – CPC for keywords in Google Ads is determined by how many other nonprofits and companies are bidding for the same terms. High competition leads to higher CPC. It’s crucial to monitor this metric to ensure you’re not overspending on non-essential keywords.
- Conversion rate – is a key metric that reveals the percentage of users who complete a desired action on your page after clicking on your ad. This may include making a donation, submitting a form, etc. It provides insight into how effectively your landing page and overall campaign are at turning interested visitors into active supporters. The definition of conversion varies from account to account but generally speaking we track all valuable website actions as conversions.
- Cost/Conv. (Cost-Per-Conversion) – represents the cost of every successful conversion.
- Impressions – the total number of times your ads are displayed within the Google search results.
- Clicks – measures the website traffic from an ad to the advertiser’s website.
- Cost – the total amount of Google Ad Grants funds used in the account.
Benchmark your Ad Grants account effectiveness
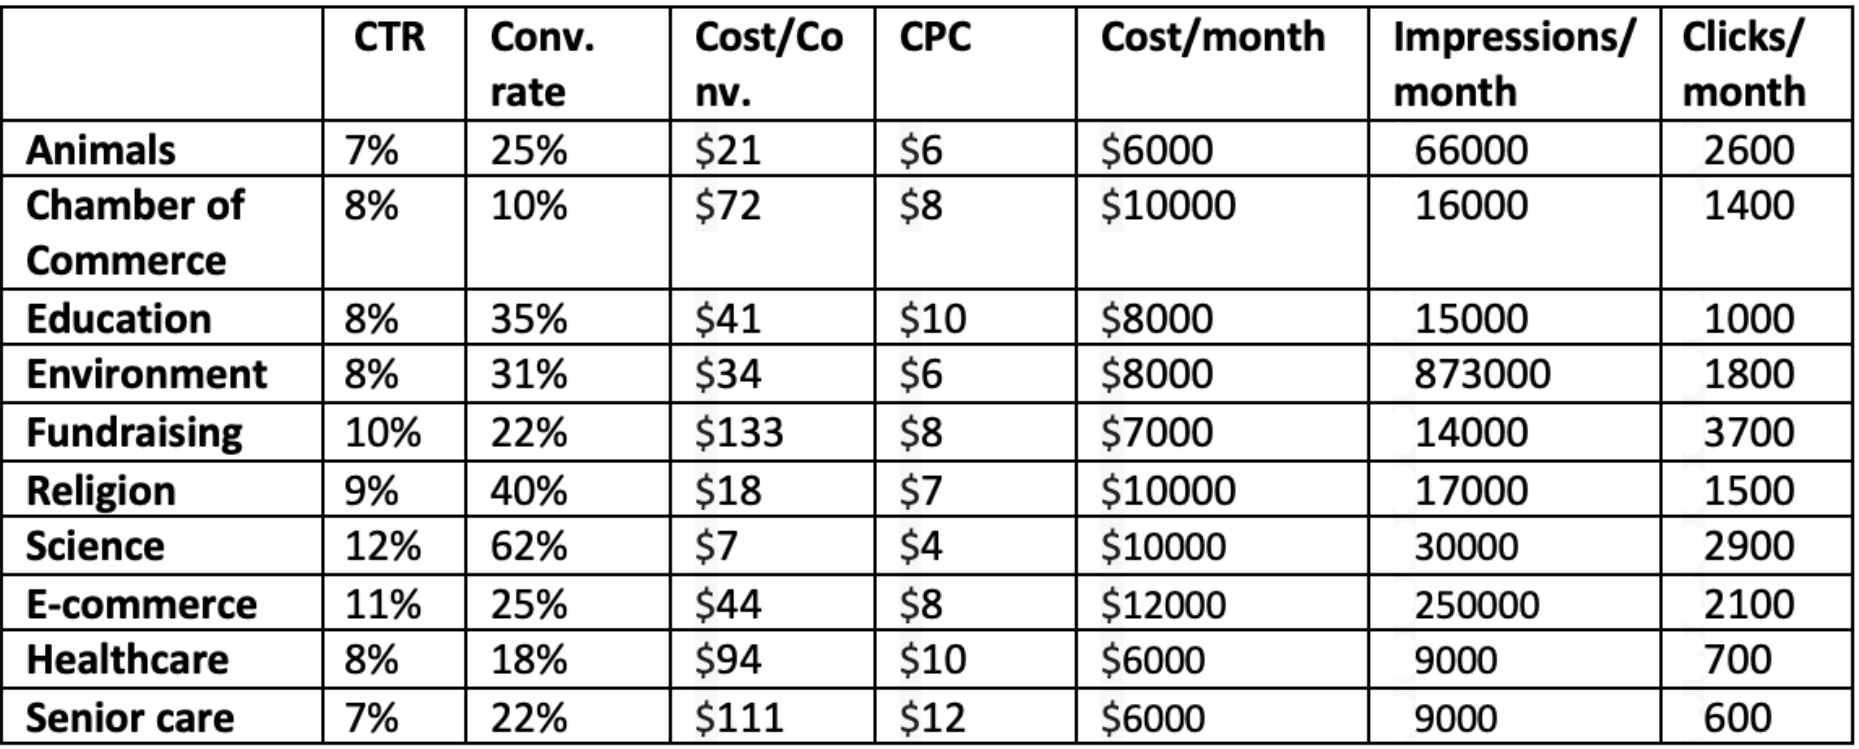
The following data represents the average KPIs of our client accounts across various categories that have been observed for the entire year of 2023:

Navigating the complexities of Google Ad Grants and maintaining high campaign performance can be daunting without experience. If you aspire to achieve impressive results like these, our team, led by a Google Ad Grants certified professional, is here to help. Let us take your campaigns to the next level—contact us today!
Back to previous pageGoogle Ad Grants account?
Schedule your free Ad Grants consultation today.
Blog
Useful Ad Grants Tips & Tricks
Contact us directly or schedule a slot to talk to our expert team!
- AboveX Digital LLC
- 4023 Kennett Pike #50116, Wilmington, DE 19807 USA
- +1 (619) 330-9997
- Mon – Fri 9:00 am – 5:00 pm EST
- info@abovexdigital.com


